As California goes, so goes the nation. Well, if that’s the case, the nation may soon see a LOT of ADUs.
since 2017, The growth of ADUs in California has been remarkable. And, their popularity there is likely only just beginning.
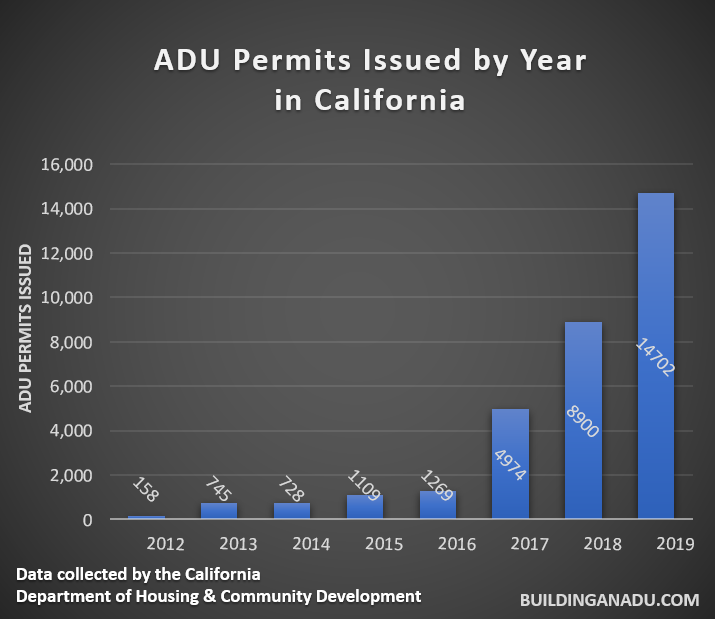
This post contains is the first statewide data depiction of ADU permit trends, charted. And, the growth is explosive.
We've seen ADU permits in Los Angeles go from 71 in 2014 to 2,342 in 2017 to 6,747 in 2019. L.A. is on the forefront of the ADU movement in California. In fact, L.A. is not only leading the pack in CA, it’s leading the pack in the nation. And, furthermore, it’s not only leading the pack in the nation, it’s leading the pack in the world in terms of sheer numbers by jurisdiction. As a percentage of total single family housing units however, Vancouver BC remains the global leader in ADUs.


California ADU permit trends charted by jurisdiction
This is based on data collected by California’s Department of Housing & Community Development. The Department of Housing cannot independently verify most of the housing development, but this is the most authoritative statewide depiction of ADU permit trends available.
Go here to see the ADU permit trends for any of California’s 527 jurisdictions. You may copy and use these charts on your website or in presentations.
Below are ADU permit trends for the forty-four jurisdictions that had at least 100 total permitted ADUs issued by 2019, starting with Los Angeles, and moving downwards from there.
| Jurisdiction and Total Number of ADU Permits Issued from 2012-2019 | Graph of permitted ADUs from 2012-2019 |
|---|---|
| LOS ANGELES: 13,431 | |
| SAN FRANCISCO: 1,338 | |
| SAN DIEGO: 869 | |
| LOS ANGELES COUNTY: 867 | |
| SAN JOSE: 791 | |
| OAKLAND: 739 | |
| SAN DIEGO COUNTY: 568 | |
| SONOMA COUNTY: 439 | |
| ENCINITAS: 355 | |
| SANTA CRUZ: 299 | |
| SANTA BARBARA: 284 | |
| GLENDALE: 276 | |
| PALM SPRINGS: 265 | |
| BERKELEY: 260 | |
| RIVERSIDE COUNTY: 248 | |
| GARDEN GROVE: 211 | |
| LONG BEACH: 210 | |
| SAN FERNANDO: 205 | |
| ORANGE COUNTY: 204 | |
| PLACER COUNTY: 202 | |
| DALY CITY: 199 | |
| SANTA BARBARA COUNTY: 191 | |
| CONTRA COSTA COUNTY: 182 | |
| CARLSBAD: 178 | |
| VENTURA COUNTY: 171 | |
| BURBANK: 169 | |
| SANTA ROSA: 166 | |
| SANTA CRUZ COUNTY: 162 | |
| EL DORADO COUNTY: 160 | |
| FREMONT: 154 | |
| SACRAMENTO: 146 | |
| CHULA VISTA: 141 | |
| SAN JOAQUIN COUNTY: 139 | |
| SANTA MARIA: 138 | |
| PALO ALTO: 132 | |
| REDWOOD CITY: 131 | |
| SANTA ANA: 126 | |
| SAN LUIS OBISPO: 119 | |
| RICHMOND: 114 | |
| SACRAMENTO COUNTY: 114 | |
| CULVER CITY: 112 | |
| SAN LUIS OBISBO COUNTY: 109 | |
| SOUTH GATE: 104 | |
| ROSEMEAD: 100 |